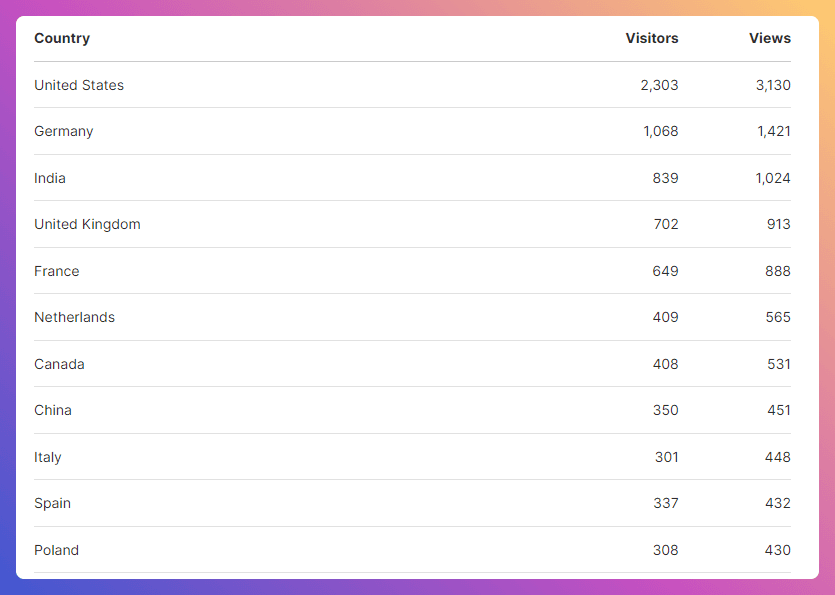
Insights report
Accylin Insights allows you to aggregrate and view your data in a variety of ways. Explore your data more extensively through the utilization of segments and filters.
The report works by segmenting your data into two main metrics Visitors and Views.
Parameters
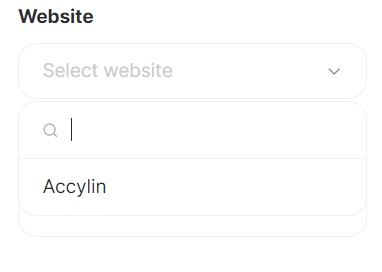
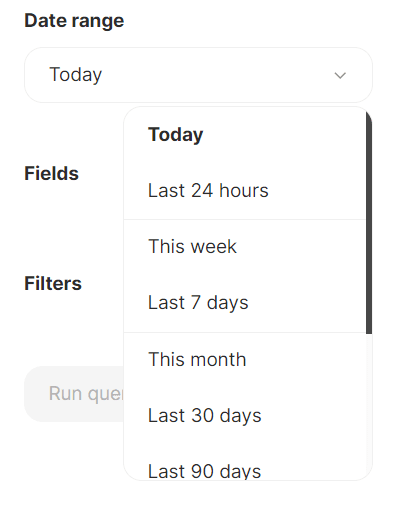
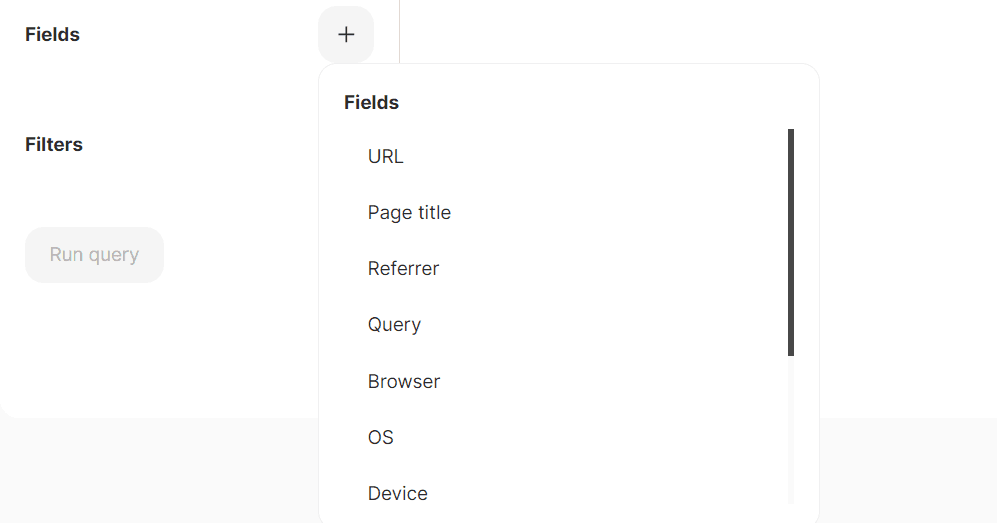
Website: (required) The website you want to run the report on.Date range: (required) The date range of the report.Fields: (required) Metric data you want to segment. This includes all data collected via the tracker script.Filters: Filters you want to apply to your report.
Create a report
Step 1: Choose a website
Step 2: Choose a date range
Step 3: Choose your field(s)
The fields include both pageview and session metrics collected via the tracker script.
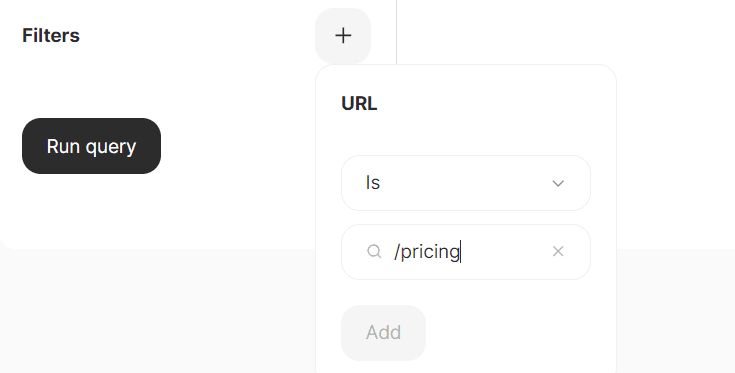
Step 4: Choose your filter(s)
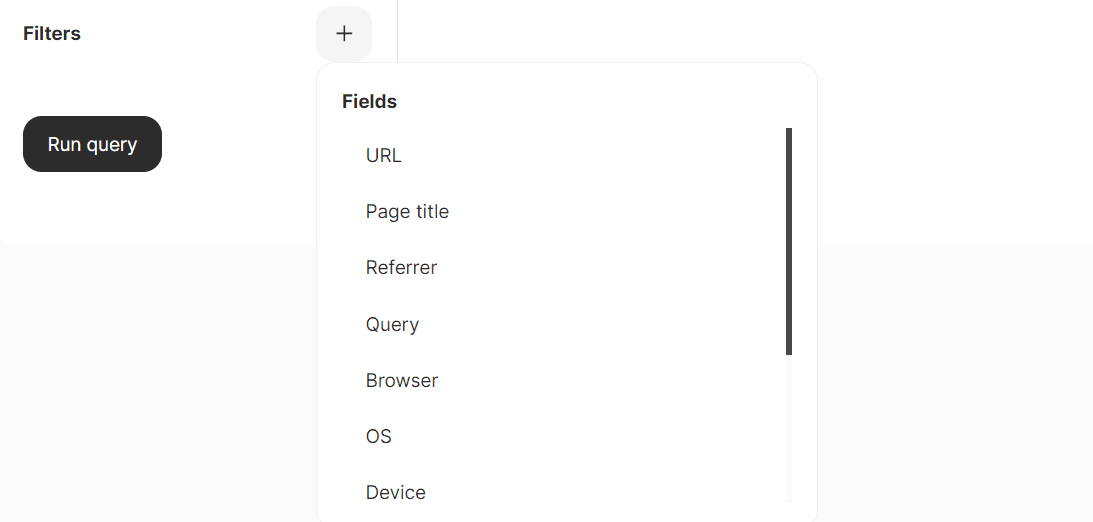
Currently you can perform Is, Is not, Contains, and Does not contain operations.
Step 5: Run query and save
Click Run Query to see your results. In order to save your report, add a title and description and click Save. The report along with its parameters will be saved for future use.
